HD Camera Measurements and getting the most out of your camera, Part 3
Author: Dennis Lennie
Published 1st May 2009
Recap Parts1 and 2:
Parts 1 and 2 covered the theory and actual measurement of white shading, making sure that the camera non-linearities introduced by various different lens systems on a particular camera are compensated. In this issue, Part 3 will investigate setting up colourimetry and exposure as well greyscale adjustments using a waveform monitor.
Setting up correct colourimetry and exposure
Shading, as discussed in the previous issue, primarily deals with the luma adjustments of the signal, but it is also important to ensure the colour fidelity of the image. Typically the aim is to reproduce the image on a monitor or television set as closely as possible to the original scene. To achieve this, an accurate test chart is required that produces a reference pattern. The camera converts this light image via, the CCD (Charged Coupled Device), to digital voltage levels. The camera then converts the signal to the HD-SDI output. This signal can then be measured using a waveform monitor such as the WFM7120 or WFM5000 to quantify the characteristics of the signal.
An accurate test chart does not negate, but complements an electronic test pattern generator by including the camera’s ‘Taking Characteristics’. ‘Taking Characteristics’ is a term frequently used to describe the many elements of the conversion of light by the camera to an electrical signal. These include the lens and adapters, the prism block, dichroic and trim filters and the colour characteristics of the CCD or other image devices. Taking Characteristics will also be affected by changes in the colour temperature and spectral distribution of the scene lighting. Accurate evaluation requires a precision test chart such as the Combi DX-1 (rear-lit Figure 8a) or (front-lit Figure 8b) ChromaDuMonde test patterns from DSC Laboratories.
These unique test patterns provide meaningful test signals that facilitate camera alignment and image control. The characteristics of grayscale and colour steps contained within the charts can be used to adjust the camera’s set-up controls. Optimising the image largely depends on the adjustment capabilities of the individual camera. The DSC colour patterns are designed to the latest (International
Telecommunications Union) ITU-R BT.709 colourimetry standard used with HD standards (SMPTE 274M and 296M).
Note the excellent wide colour gamut of the NTSC standard as shown in Figure 9. When television sets used this standard they did not sell well because the picture was too dim and had to be viewed in a darkened room. For this reason the
colourimetry component of the NTSC standard was replaced by SMPTE C. This greatly reduced colour gamut but provided a much brighter image.
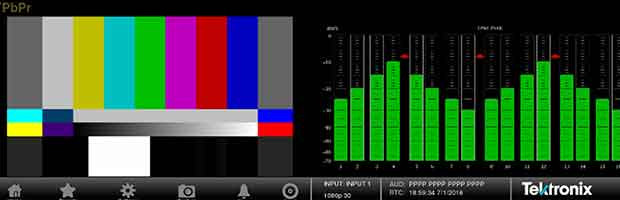
It is important to understand these differences in colourimetry between HD and SD when viewing the waveform monitor display. In Figure 10, a 100% colour bar test signal for both HD and SD formats is shown, in a YPbPr waveform display. Notice the difference of the Y-channel Green-Magenta transitions between the HD and SD signals. Users who are familiar with SD signals may initially consider the HD signal to
be incorrectly adjusted. This is not the case. This difference in levels of each colour component is normal and due to the different colourimetry equations used between HD and SD.
Grayscale adjustments using the waveform monitor
While it is a relatively simple procedure to set-up correct exposure levels using a grayscale chart, failure to use a truly neutral grayscale can result in serious tracking errors. Typical grayscale charts are more yellow in the light steps, approaching neutral towards black. Use of such charts produces images that are artificially blue or cold looking in the lighter tones. In many cases this is not desired in images because viewers either prefer warm-looking images or the look of picture is intended to be warmer. Patented technology from DSC Labs has eliminated this problem by making every step of the grayscale neutral.
When using a grayscale test pattern both dynamic range and progression between steps become important. In the early days of television, the dynamic range of a camera was limited to about 25:1 and grayscale patterns had a correspondingly
low dynamic range. Today’s modern charts have an 11 step pattern. The progression rate is different between the 9 step and 11 step patterns. The 9 step is logarithmic in terms of reflectivity while the 11 step is designed to produce steps that are linear in voltage. The lightest step on a 9 step chart reflects 60% of the light falling on it. By comparison, 90% is reflected from the white chip on an 11 step chart. The DSC chart (Figure 8b) shows an 11 step grayscale. Note the 11 step pattern has a greater dynamic range with the white chip being lighter and the darkest chip being darker than a typical 9 step pattern. The different densitometric curves between test patterns result in significantly different image reproduction from camera aligned to a 9 or 11 step chart. Aligning to inaccurate grayscales of limited dynamic range can result in poor quality images that are virtually beyond redemption.
The Diamond display can be used to aid in the alignment of a grayscale chart. If the signal is aligned correctly the trace will produce a straight vertical line as shown in Figure 6. A deviation from the straight line will show an error within the RGB components. Figure 11 shows the lower trace is bent towards the Red axis indicating incorrect adjustment of the Red channel.
While every engineer and DP (Director of Photography) has their own special techniques for aligning a camera, the following procedure is quite typical. With a camera focused and framed on an evenly lit ChromaDuMonde or back lit Combi pattern, the iris is set to mid-scale (typically between f4 to f8) and the exposure/iris
is adjusted to set the white chip of the DSC grayscale to 700 mv (100%). Tracking of the RGB channels should be checked to ensure neutral reproduction across the grayscale.
White and black balances are then set. (Incidentally, because all DSC colours combine to produce a neutral colour balance, most cameras will white balance on a DSC colour chart as accurately as on a true white card). The true black chip on the CamAlign or ChromaDuMonde Grayscale is normally set close to 0 mv, while test patterns equipped with a DSC CaviBlack will allow the black point to be set more accurately. Note: If monitoring an NTSC composite output from the camera, this uses a black level setup of 7.5IRE above true black in North America. However in Japan NTSC signals have no setup and therefore black will be referenced to 0 mv. The gamma or crossover step of the 11 step chart is typically adjusted to produce a straight line. This results in an accurate grayscale reproduction. It is important to note that while a camera may reproduce a grayscale perfectly, its colour reproduction can still be very poor.
In Part 4 in the next issue, colour adjustment using the waveform monitor and camera matching will be discussed.