HD Camera Measurements. Getting the most out of your camera, Part 5
Author: Dennis Lennie
Published 1st July 2009
Recap previous Parts:
While the first parts covered the theory and actual measurements of white shading, setting up colorimetry, exposure, greyscale adjustments, alignment and matching of cameras using a waveform monitor, this final part is devoted to providing a better understanding of the displays used.
Interpreting a waveform monitor display
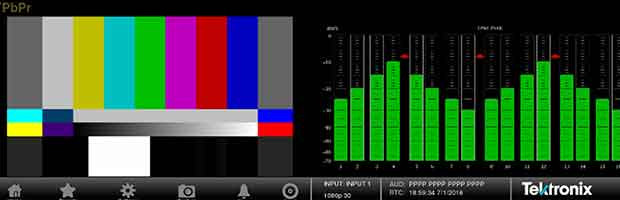
A Waveform Monitor is a means to visualize the video signal by displaying the amplitude level in the vertical axis with lower levels representing the black parts of the image and the upper axis representing the brighter higher luma levels of the signal. Black level is shown at the 0% point and white is represented at the 100% graticule mark (700 mV). Time is displayed in the horizontal axis increasing from left to right. There are a variety of methods to display the individual components of the signal either as a parade with each component side by side for comparison or as an overlay where each component is overlaid on top of each other. The time per division is indicated within the lower part of the display.
A video signal is comprised of a number of lines which make up the complete image; these lines can be displayed in a number of different ways on a waveform monitor. In Line mode all the lines of the signal are overlaid on top of each other to show the overall magnitude of the signal (the brighter the area of a region within the display the more often the signal is present at that level). In Field mode, the lines of the signal are displayed one after the other to show the variation of the signal through the image.
Understanding the vector display
The vector display is an X-Y plot of the colour difference components with Pb (B’-Y’) plotted on the horizontal axis and Pr (R’-Y’) plotted on the vertical axis. Within the instrument’s vector display the user can select a 75% or 100% graticule. When taking measurements make certain the source signal amplitude matches the vector graticule. When the user applies a 100% or 75% colour bar signal and uses the appropriate graticule selection the waveform monitor trace display should fit within the graticule boxes for each colour component. If either colour component has the wrong amplitude, the dots they produce will not fall in the graticule boxes. For example, if the P'r gain is too high, the dots will fall above the boxes in the top half of the screen and below the boxes in the bottom half. The polar display permits measurement of hue in terms of the relative phase of the chroma signal. Amplitude of the chroma signal is the displacement from centre towards the colour point. The transitions from one point to another also provide useful timing information. These timing differences appear as looping or bowing of the transitions.
Understanding the Tektronix Diamond Display
The Tektronix Diamond display was created to help visualize the interaction of the Red, Green and Blue components. The Diamond display is generated by combining the R’, G’ and B’ signals into a two dimensional display. When first looking at a 100% colour bar signal on the Diamond display it may not be immediately obvious how the signals are combined to produce the display, but understanding how the Diamond display is constructed and how it can be used for RGB colour space can greatly simplify camera adjustments.
If the video signal is in another format, such as YPbPr, the components are first converted into R’, G’ and B’ colour space. The upper diamond is formed from the transcoded signal by applying B'+G' to the vertical axis and B'-G' to the horizontal axis as an X-Y plot. The lower diamond is formed by applying –(R'+G') to the vertical axis and R'-G' to the horizontal axis. The two diamonds are displayed alternately to create the double Diamond display. Appropriate low pass filters are applied to the signal to eliminate short-term out-of-limits signals that are usually the product of combining different bandwidth signals between the luma and colour difference components.
By forming these X-Y plots of G’ & B’ in the upper diamond and G’ & R’ in the lower diamond, the display provides an easy way to visualize components within RGB gamut as the trace falls within the graticule bounding box. If the trace falls outside the graticule it is out of gamut. Errors in the Green signal affect both diamonds equally. While Blue errors affect the upper diamond and Red errors affect the lower diamond.
An enhancement to the Tektronix Diamond display is the Split Diamond display which allows errors in the black region of the signal to be more easily. The Diamond display can be an ideal tool for camera adjustments of the luma signal. If the camera is pointed at a white chart of gray scale chart and is properly balanced the trace will be a straight vertical line from the centre (Black) to the top and bottom (White). Any imbalance in the signal’s components will cause a bend of the trace.
We would like to thank all readers for their interest in this series dedicated to camera measurements, intended to help the cameramen and -technicians to operate the equipment effectively while controlling the colourspace and correct gamut for television distribution and to provide footage to postproduction that can be edited easily to eventually create great looking content that persists within the regiment digital video specifications.